


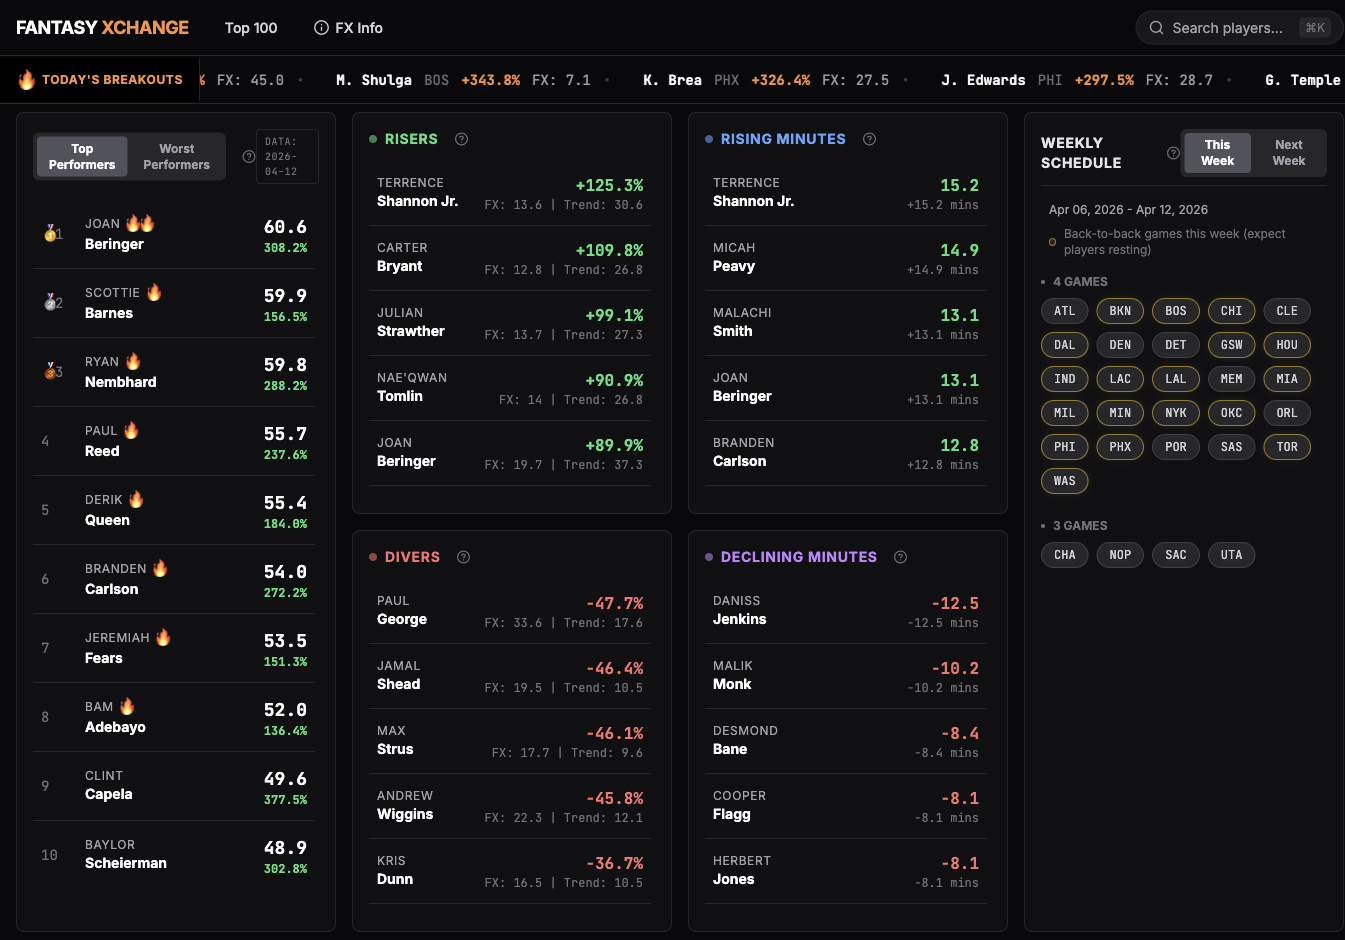
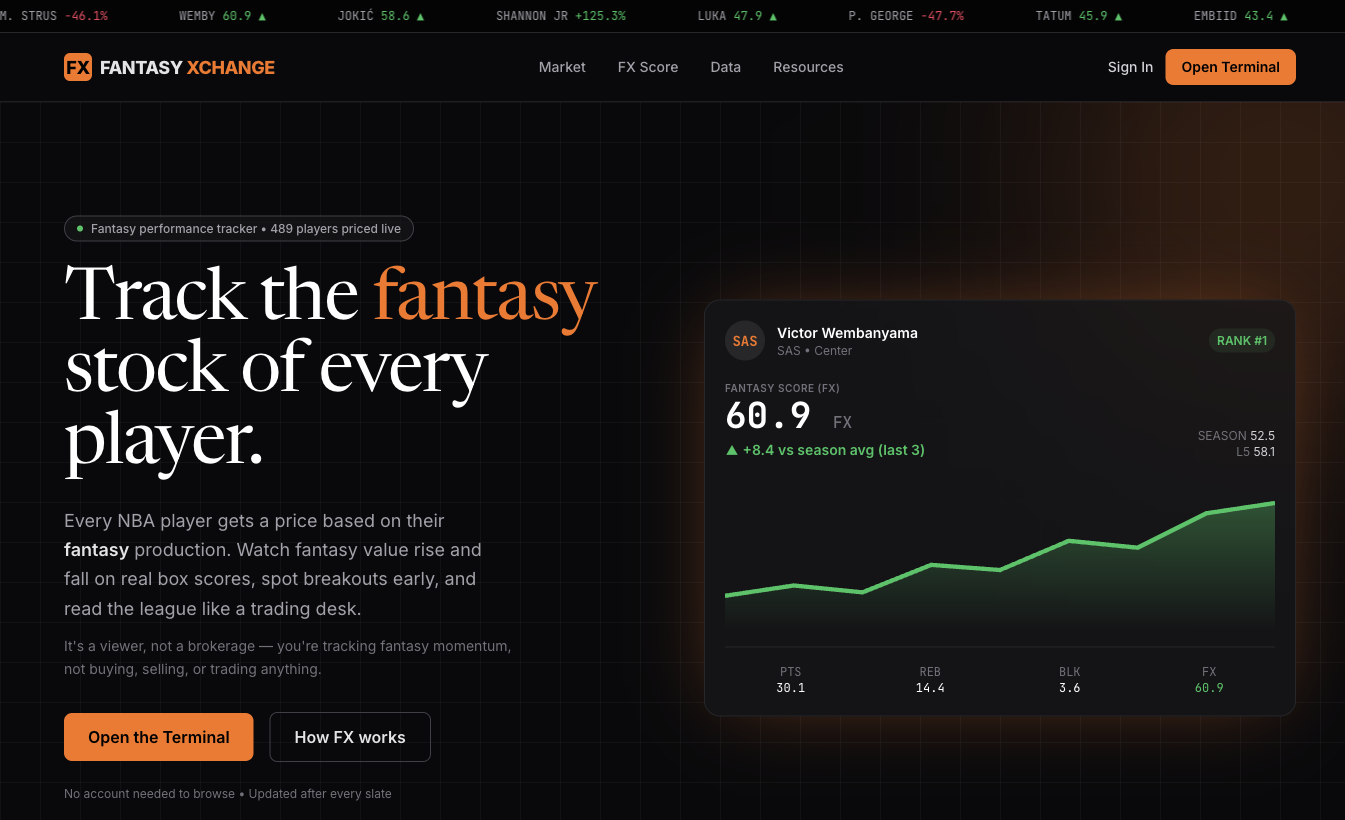
TL;DR — I built Fantasy Xchange (FX), a web app that turns every active NBA player into a fantasy "ticker" you can track. Each player gets a single price (the FX Score) driven by their real box scores, and the whole league renders as a dark, Bloomberg-style finance terminal — risers, divers, breakouts, a live ticker, plus a small quant lab that runs factor research on fantasy production. It's a full product: FastAPI backend, Svelte 5 frontend, Supabase, and a daily sync worker, all independently deployed. Try it live.
Why I built it
Fantasy managers already think like traders. You "buy low" on a breakout, you "sell high" before a player's minutes dry up, players "rise" and "fall." I wanted to lean all the way into that and see if I could make fantasy basketball feel like watching a market — and use it as a serious product-engineering project: real data pipeline, real services, real deploys, not a toy.
The pitch in one line: what if you could watch an NBA player's fantasy value the way you watch a stock?
How it works
Everything is built on one number.
- Player = stock. Every active player is a ticker.
- Price = FX Score. A single value that summarizes a player's all-around fantasy production from a game.
- Momentum = form. Recent games vs. their own season baseline tells you who's heating up or cooling off.
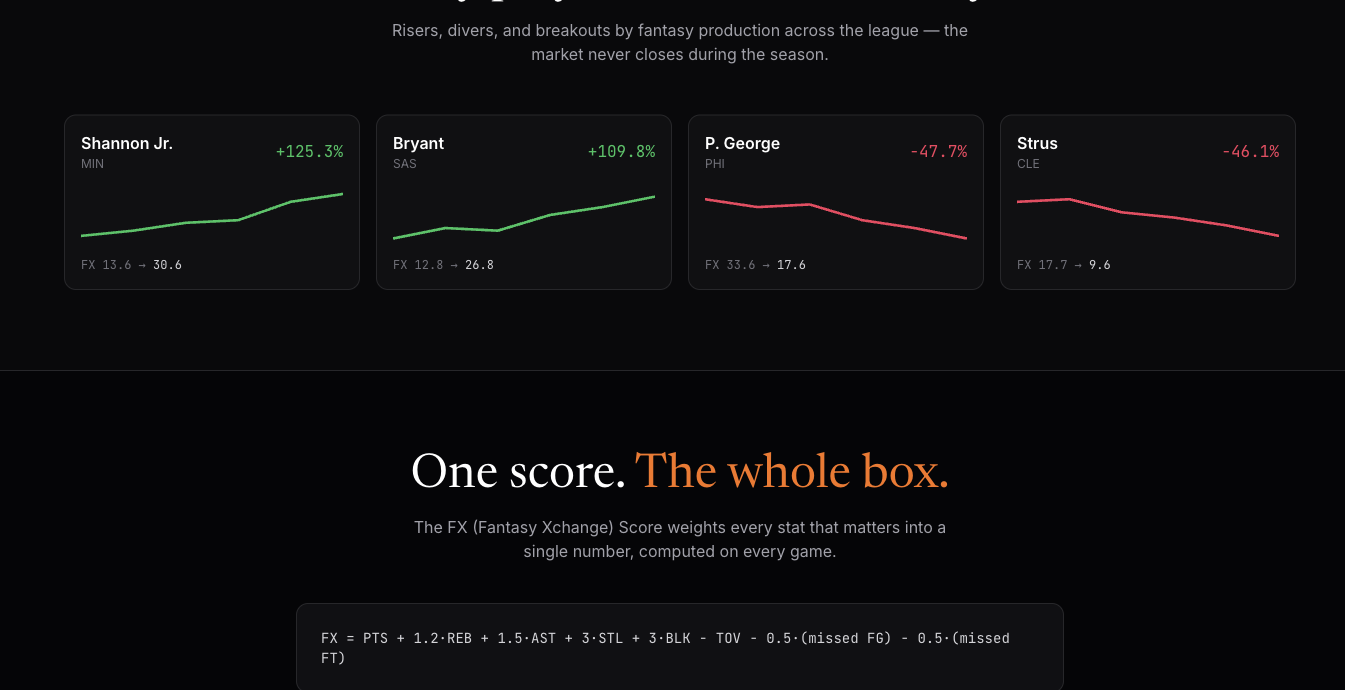
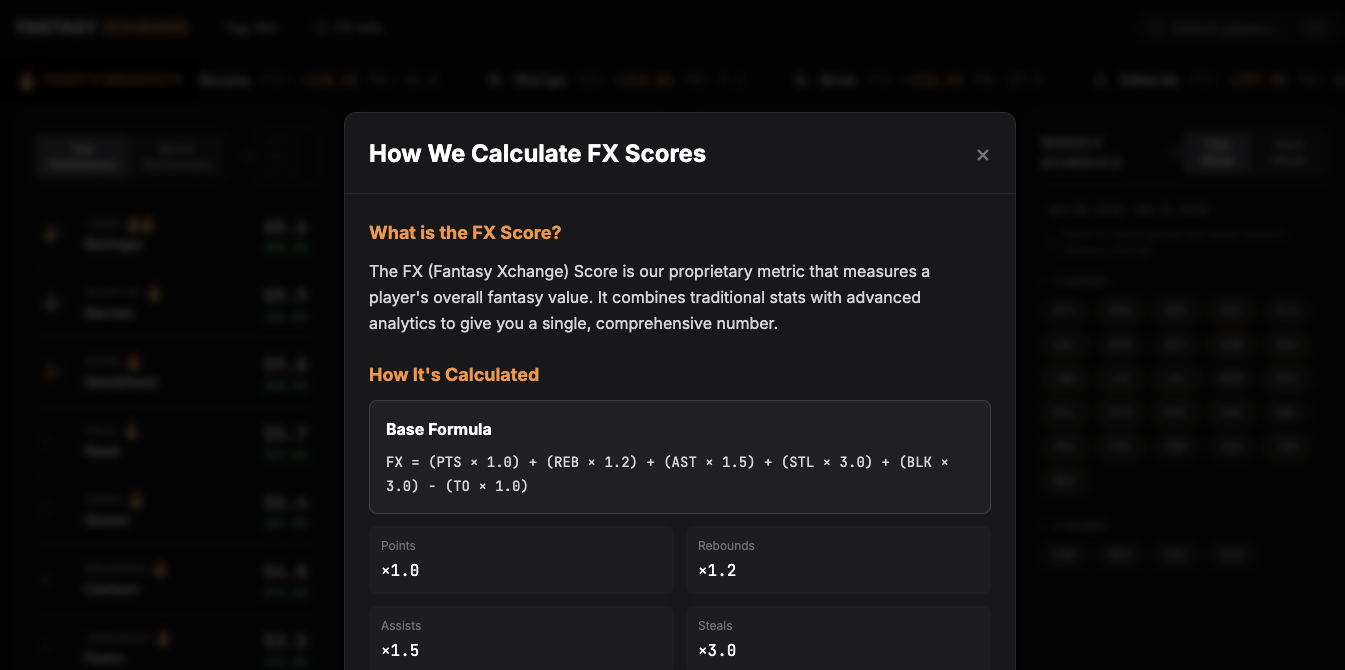
The FX Score is computed from the real box score — points, rebounds, assists, with steals and blocks weighted heavily (rare, high-signal), and penalties for turnovers and missed shots. It collapses a messy stat line into one comparable number, and the entire product is built on top of it.
From there, momentum drives the dashboard:
rise % = (recent 3-game avg − season avg) / season avg
- Big positive → breakout / hot streak
- Big negative → slump
- Same logic on minutes → surfaces role changes before the box score catches up
How you use it
You open the terminal — a four-panel dashboard that reads like a trading screen:
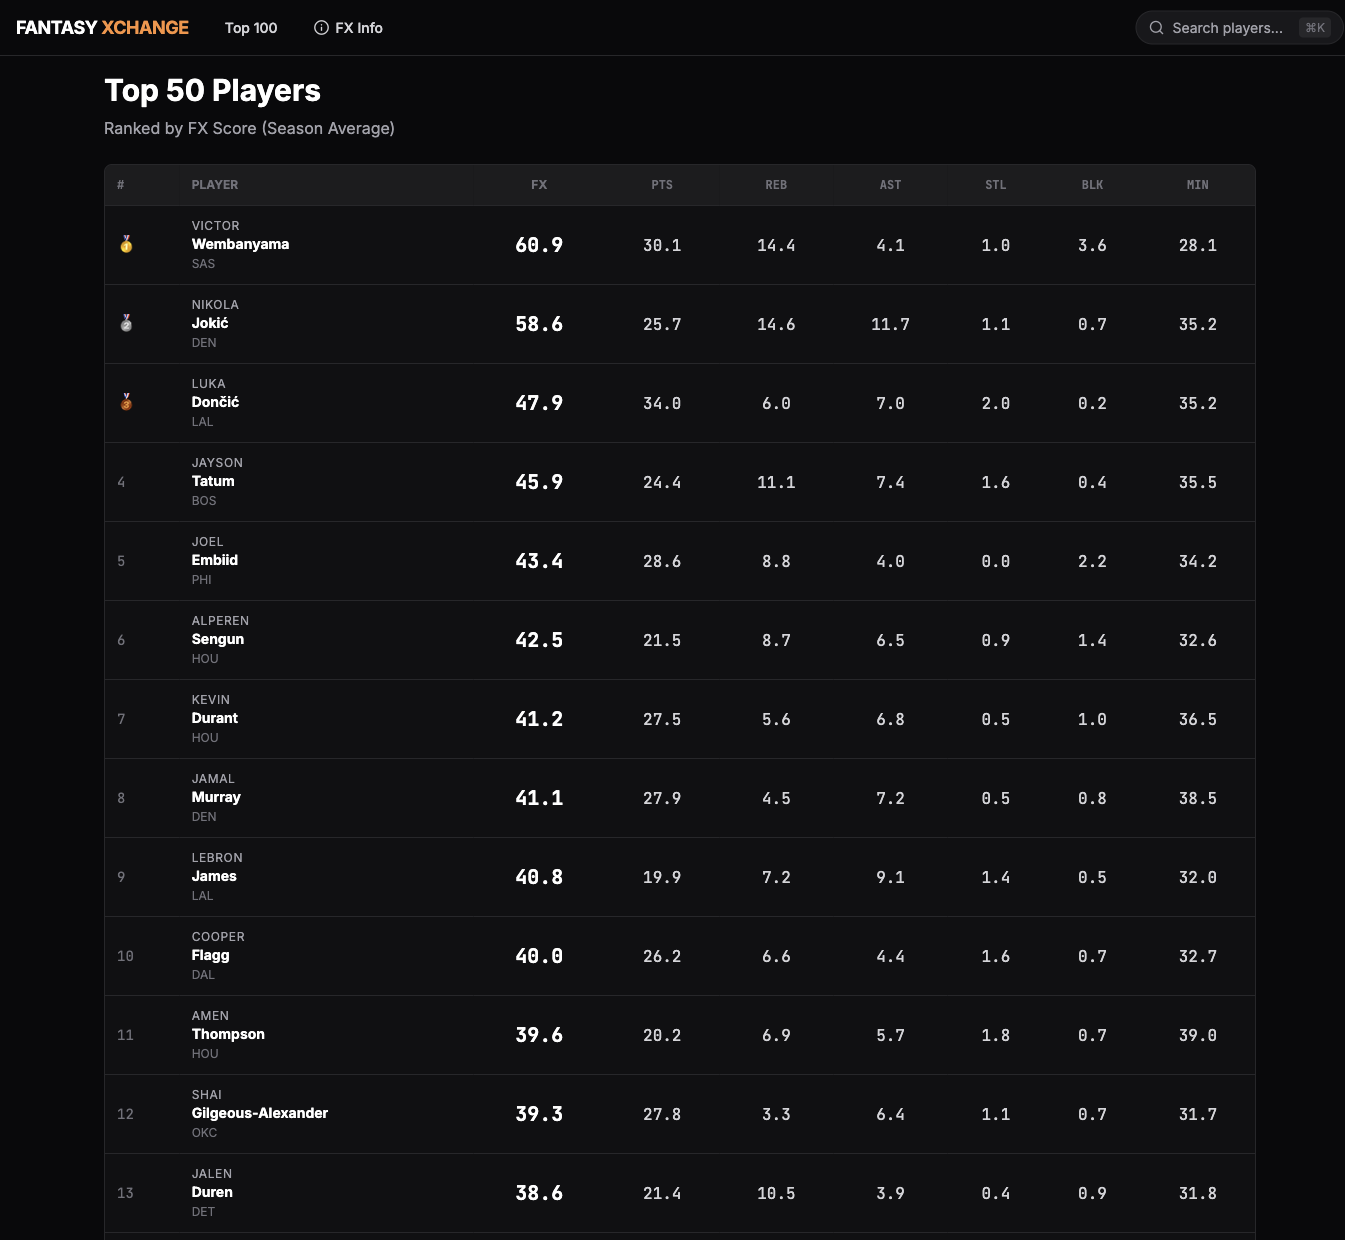
- Daily Leaderboard — best and worst FX on the latest slate
- Market Movers — top risers and divers vs. season baseline
- Opportunity Watch — players gaining or losing minutes (role expansion before production follows)
- Weekly Schedule — game density and back-to-backs, for streaming decisions
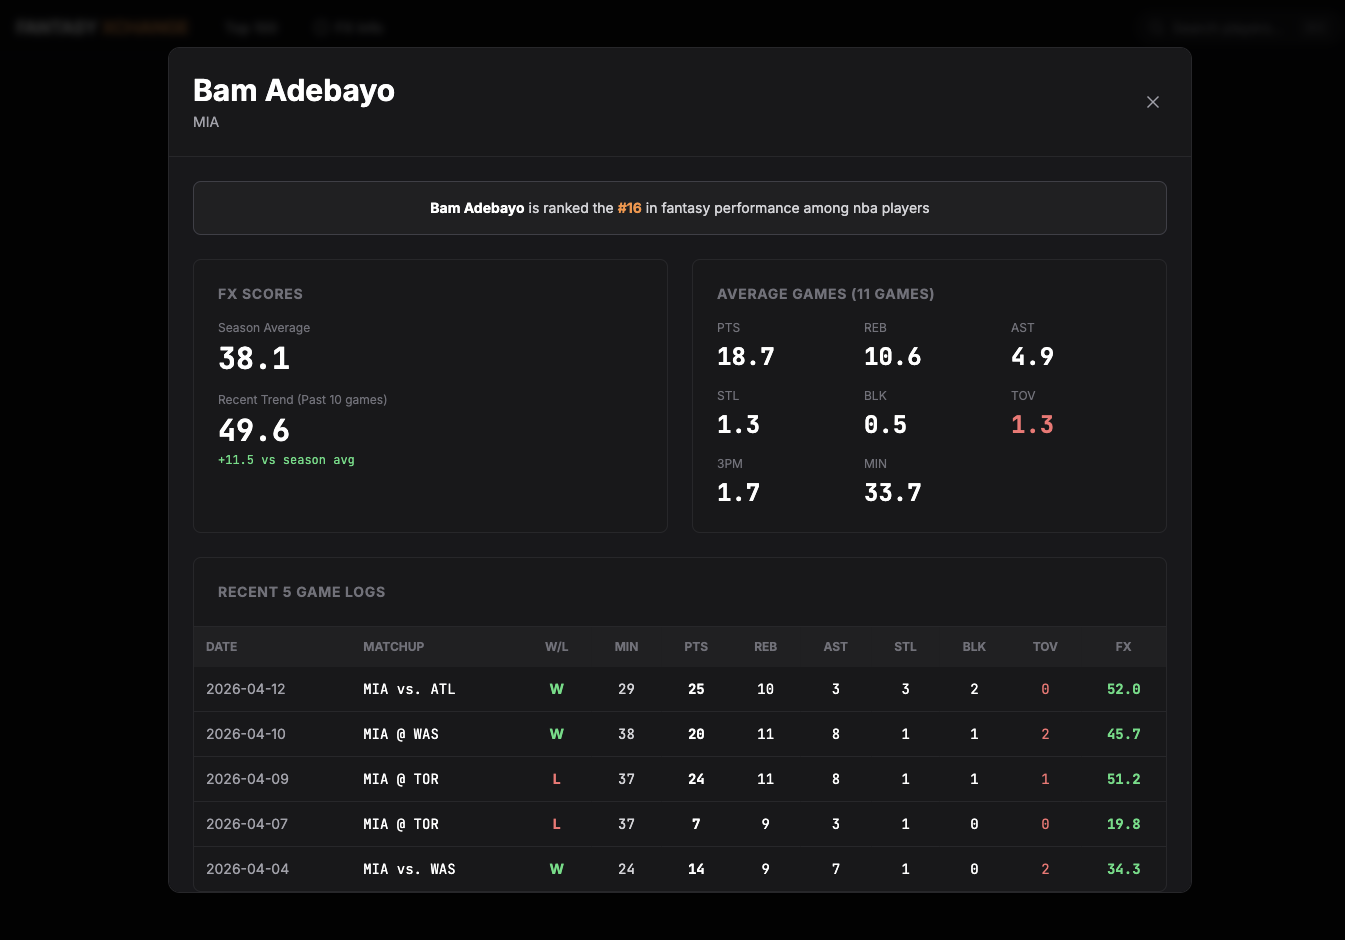
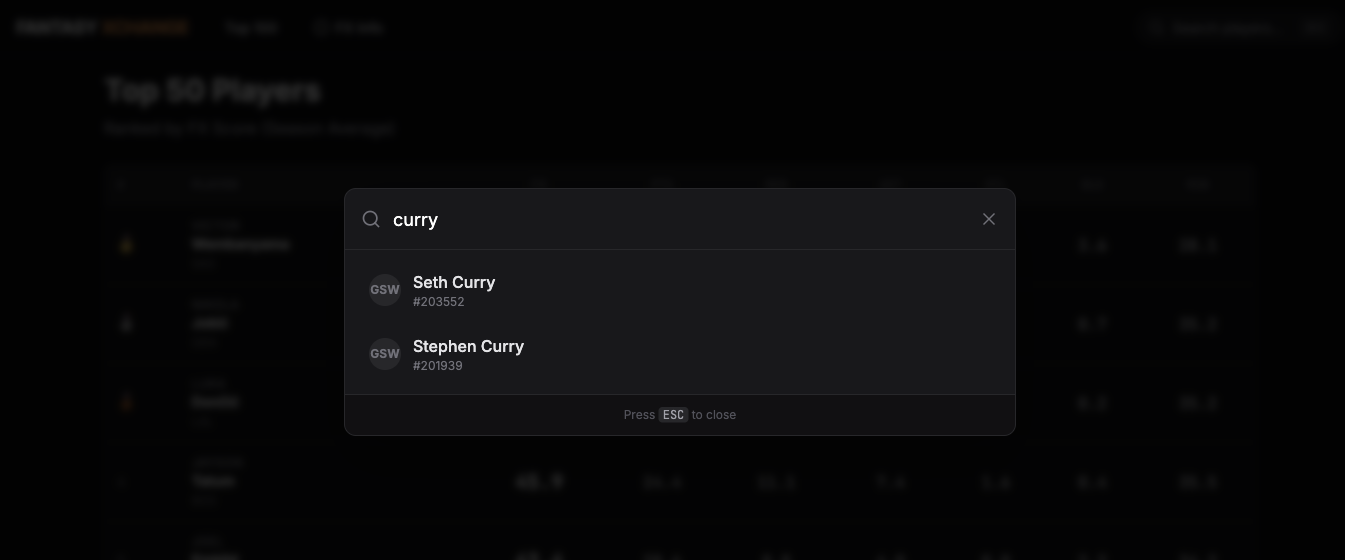
Click any player to pull up their detail card — season FX, averages, league rank, recent game log. There's a ⌘K command-palette search, a live ticker strip, and a breakout ticker for single-game spikes.
Example: finding a waiver-wire sleeper
- Open Opportunity Watch → a bench player's minutes are trending up sharply
- Their FX is still middling, so nobody's noticed yet
- Cross-check Market Movers → momentum just turned positive
- That's your "buy low" — role is expanding, production usually follows
The app never tells you to draft anyone — it surfaces the signal, you make the call.
The quant lab
Two screens take the metaphor further and apply real systematic-investing concepts to fantasy data — paper analytics only, no overclaiming.
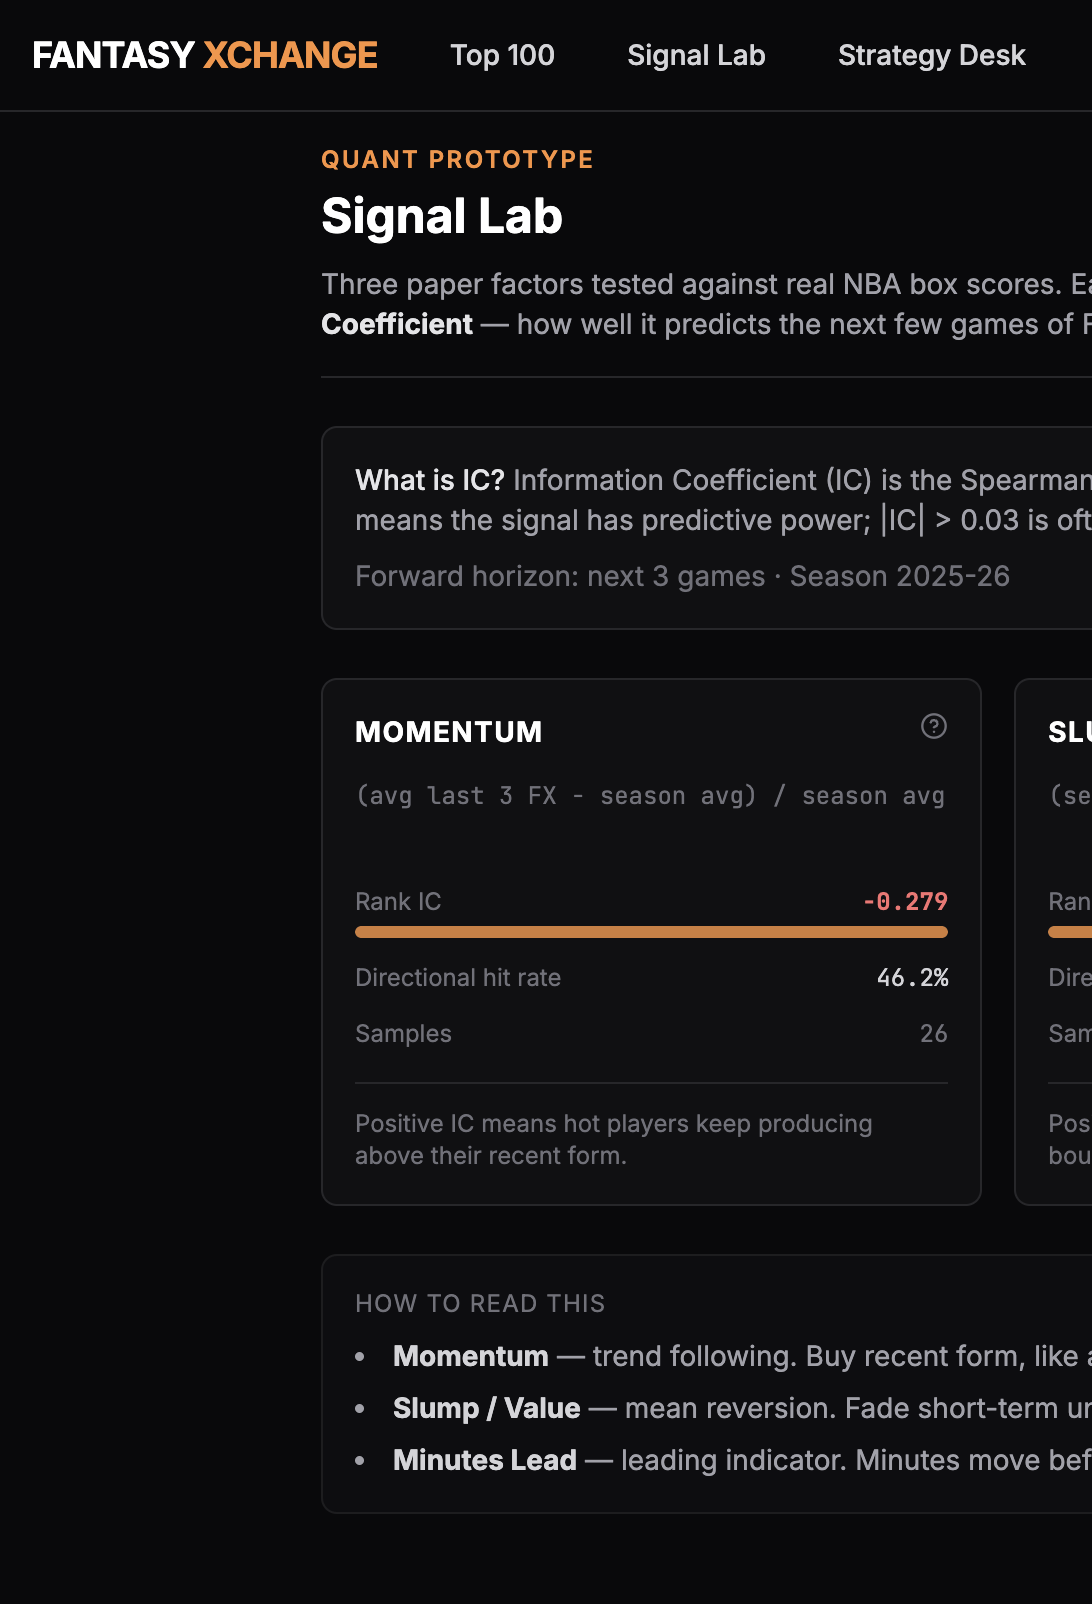
- Signal Lab runs factor research on three signals (momentum, mean-reversion/value, minutes-lead) and scores each with an Information Coefficient — the same rank-correlation metric quant desks use to ask "does this signal actually predict the next few games?"
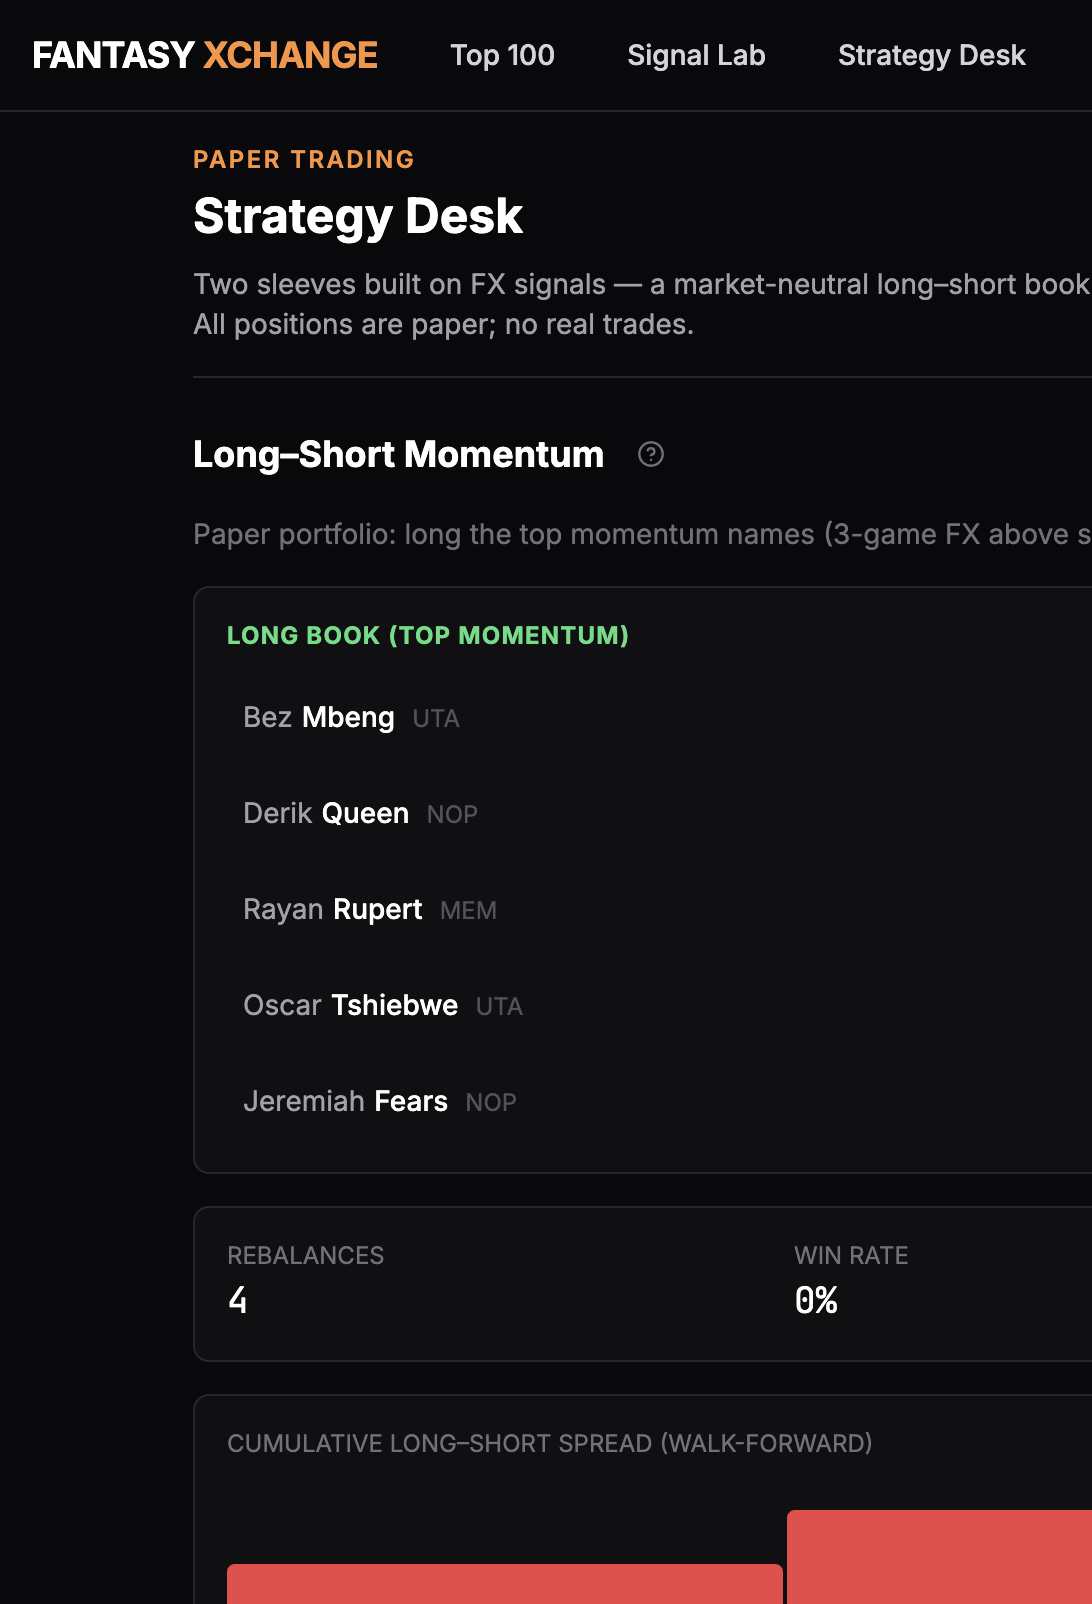
- Strategy Desk runs a paper long–short momentum book (long the top movers, short the bottom, care about the spread) with a walk-forward backtest, plus a mean-reversion watchlist gated on minutes stability — i.e. slumping players whose role is still intact, so a bounce is plausible.
Takeaway
The fun was making fantasy hoops feel like a live market while keeping the engineering honest underneath — one clean metric, a UI that sells the metaphor, and a backend solid enough to feed it fresh every night.
Technical implementation
For the engineering-minded. Fantasy Xchange is three independently deployable services around managed Postgres — built so the thing that writes data can never take down the thing that serves it.
Architecture
- Frontend — Svelte 5 (runes), Vite, Tailwind, deployed on Railway. Pure presentation, talks only to the API.
- Backend — FastAPI + Pydantic, serving rankings, player, schedule, and strategy endpoints, plus the sync + FX computation.
- Datasync worker — a scheduled cron service that wakes nightly and triggers the backend's sync endpoints behind an API key.
- Database — Supabase (Postgres + PostgREST). Backend-only access via service-role key; clean HTTP seams between every service.
Engineering decisions that make it feel real-time and robust
- Pre-compute for read speed. FX Score and all trend aggregates (
fx_season, last-3, last-5, minutes trends) are computed at ingest, so the dashboard just sorts indexed columns — no live number-crunching on the read path. - Idempotent ingestion. Everything upserts, so re-running a day is safe and backfills are just a re-trigger. One
LeagueGameLogcall per slate instead of hammering the API per player. - Date-anchored windows. "Today" anchors to the most recent date with games, not wall-clock time — so the terminal is never blank on an off-night or in the off-season.
- In-memory TTL cache on the hot ranking and strategy endpoints (5-min), keeping the terminal snappy under repeated reads.
- Stateless services. No server sessions, horizontally scalable, sync is fire-and-forget via background tasks so the worker returns immediately.
The quant engine
- A pure-Python strategy module computes Spearman-rank Information Coefficient, signal values, the long–short book, and the walk-forward backtest (rebalance every Nth game date, forward-window the next 3 games per leg, measure the spread).
- Wrapped in cached FastAPI routes with Supabase pagination over the game-log history.
Frontend craft
- Svelte 5 runes (
$state,$derived,$effect) driving a custom finance-terminal design system — near-black theme, orange accent, green/red deltas, serif hero type, monospace data, CSS-animated tickers. - Client-side state routing with a cookie-gated landing page (7-day window), runtime-injected API host for portable deploys, and a
fetchSmartDatehelper that gracefully falls back a day if the latest slate is empty.
The through-line: one metric, pre-computed and served fast, behind small decoupled services — the product reads as a slick live market because the boring parts (ingestion, caching, date logic) are doing the heavy lifting underneath.
Note: written with the help of an llm from my project + own points, dont mind the emdashes or llm-ish words :>